INTRODUCCIÓNLa soya (Glycine max (L.) Merrill)
es la oleaginosa más cultivada y el cuarto grano más producido después
del maíz, trigo y arroz. En el mundo se producen un promedio de 176,6
millones de toneladas de soya al año sobre una superficiede 75,5
millones de ha 1, conformando el 80 % de
este volumen los Estados Unidos, Argentina y Brasil, lo que explica que
América sea el continente con mayor producción a nivel mundial con el
85,32 %, seguido por Asia que representa el 12,78 % 2.
Por otra parte, a pesar de que en Cuba se conoce la soya desde inicios
del siglo XX, aún no se ha podido estabilizar su producción, pues se
siembran alrededor de 20 000 ha que solo logra satisfacer el 35 % de la
demanda nacional, lo que obliga al país a importar unas 600 000
toneladas anuales 3.
Sin embargo, la soya está sujeta a muchos estreses abióticos que reducen su rendimiento 4,
al igual que la mayoría de los cultivos económicamente importantes.
Para que se puedan alcanzar rendimientos estables en el tiempo o bien
incrementarlos es importante tener en cuenta la interacción entre los
genotipos y el ambiente (clima, suelo y prácticas de manejo), ya que
cualquier variable que produzca efectos sobre el medio va a verse
reflejada en la productividad del cultivo 5.
En trabajos realizados con el fin de abordar la estabilidad del
rendimiento en diferentes cultivares de soya, se ha determinado que aún
en sistemas sustentables de alta producción, hay gran variabilidad del
mismo. Por lo tanto, para alcanzar elevados rendimientos se requiere
seleccionar aquellos cultivares que presenten una elevada productividad
media (adaptación) y conocer su probable variación entre ambientes
(estabilidad) 6.
De
igual modo, existen diversas investigaciones a nivel mundial que
evalúan la incidencia del clima en relación con la fecha de siembra 7.
Este aspecto es importante a señalar, debido a que la mayoría de las
variables meteorológicas, como las temperaturas y la radiación solar,
afectan el crecimiento y desarrollo de los cultivos positiva o
negativamente, a la vez que modifican su entorno y alteran la producción
tanto de materia seca como del rendimiento 8.
En
correspondencia con los criterios anteriores, es necesario el
conocimiento de los principales factores que causan variabilidad en el
rendimiento del cultivo de la soya, por lo que el presente trabajo se
desarrolló con el objetivo de evaluar la variabilidad del rendimiento en
cultivares de soya (Glycine max (L.) Merrill), asociados a variables meteorológicas según fecha de siembra en la época de frío.
MATERIALES Y MÉTODOSLos
experimentos se desarrollaron en la Unidad Científico Tecnológica de
Base, Los Palacios (UCTB-LP), perteneciente al Instituto Nacional de
Ciencias Agrícolas, situada en la llanura sur de la Provincia de Pinar
del Río, a los 22°44’ de latitud Norte y a los 83°45’ de latitud Oeste, a
60 m s.n.m, con pendiente aproximada de 1 %. Se evaluaron cuatro
cultivares de soya de procedencia vietnamita (DVN-5, DVN-6, DT-84,
D-2101), los cuales fueron sembrados en tres fechas de siembra
diferentes; diciembre 2011, enero 2012 y diciembre 2012,
correspondientes a la época de frío.
El suelo del área experimental se clasifica, según la Nueva Versión de Clasificación Genética de los Suelos de Cuba 9,
como Hidromórfico Gley Nodular Ferruginoso Petroférrico. Como
resultados del muestreo de suelo del área experimental, se muestran
algunas propiedades que caracterizan su fertilidad (Tabla 1).
Las principales características de los cultivares en estudio se presentan en la Tabla 2
3, los que se sembraron por siembra
directa a distancia (manual), de 0,70 m entre surco y 0,07 m entre
plantas, con una norma de 54 kg ha-1 de semillas. Las labores fitotécnicas se realizaron según lo recomendado en el Manual Técnico del Cultivo de Soya 10.
Se empleó un diseño experimental de bloques al azar con cuatro
tratamientos (los cultivares) y tres réplicas. Las parcelas
experimentales contaron con un área de 30 m2.
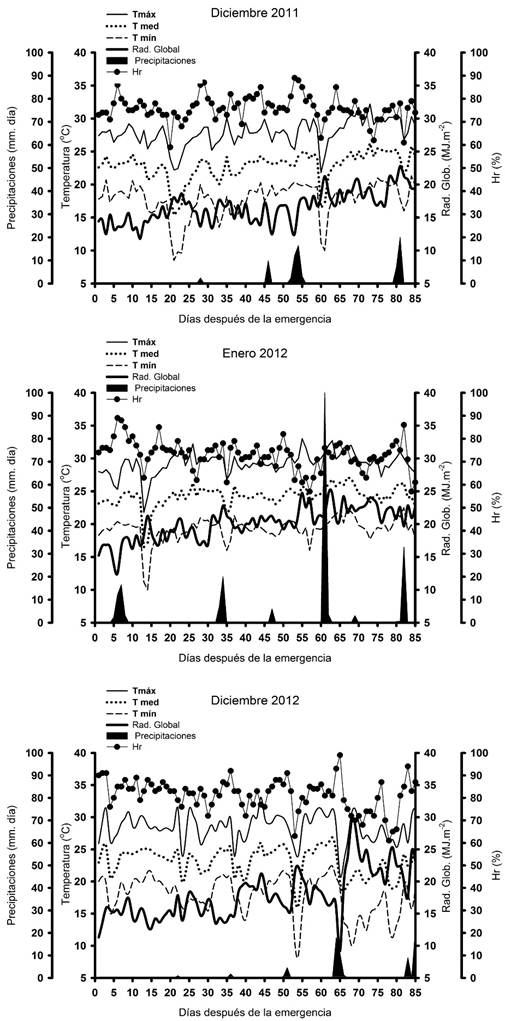
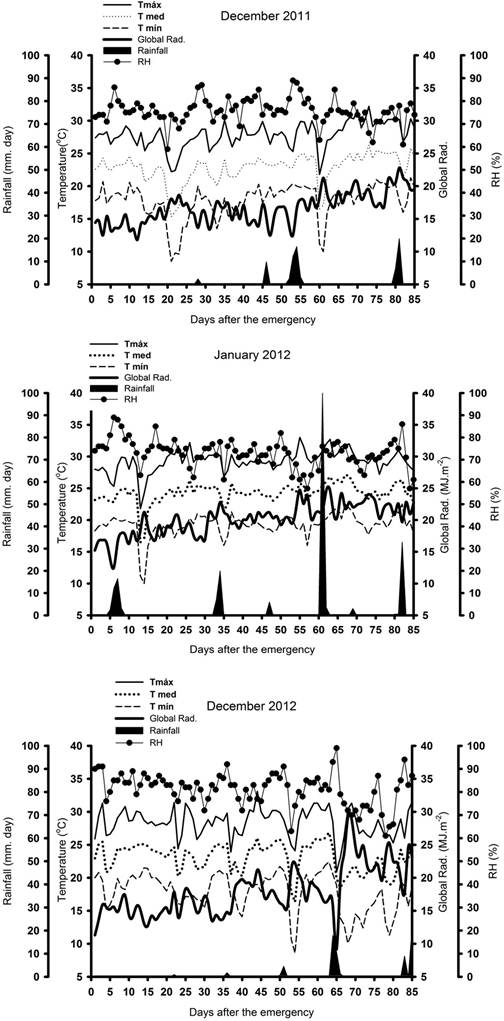
En la Figura 1 se registra
la temperatura máxima, mínima y media diaria (T máx, T mín, T med), las
precipitaciones, la radiación solar global (RSG) y humedad relativa
(Hr), del período en que duraron los experimentos, los cuales fueron
obtenidos de la Estación meteorológica de Paso Real de San Diego, en Los
Palacios.
La sumatoria térmica o grados día acumulados (GDA) fue calculada por el siguiente método 11:
Donde en este caso se seleccionó como temperatura base a 10 °C y n el número de días en el período considerado.
En
cada parcela experimental en el momento de la cosecha se tomaron diez
plantas representativas al azar, siempre respetando el área de borde y
fueron determinados:
Rendimiento agrícola (t ha-1, ajustado al 14 % de humedad) (Rto).
Número de vainas por planta (No vainas).
Número de granos por planta (No granos).
Masa de mil granos (Masa 1000).
Para determinar el rendimiento agrícola se cosecharon 8 m2
del centro en cada parcela experimental, se trillaron las plantas y se
secaron los granos hasta alcanzar el 14 % de humedad. En cuanto al
número de granos y número de vainas, se contabilizó el valor de cada
variable en las diez plantas por parcela.
Se
caracterizaron climáticamente las tres fechas de siembra a través de un
análisis de componentes principales con dichas variables, dividiendo el
ciclo del cultivo en tres períodos: Ve-R1, etapa de prefloración e inicio de la floración; R1-R5,
etapa reproductiva temprana en la cual se establecen la mayoría de los
frutos y comienzo del llenado de las semillas, y la tercera etapa es R5-R7, período de llenado de las semillas 12.
Las
medias de las variables evaluadas obtenidas por cultivar y fecha de
siembra, se sometieron a análisis de varianza (ANAVA), y las diferencias
significativas entre las medias se determinaron con el test de LSD de
Fisher (p<0,05). Varias matrices de datos fueron construidas las
cuales se procesaron por la técnica multivariada de Componentes
Principales, mediante la representación de un Biplot. Se utilizó el
paquete estadístico InfoStat versión 2015 13.
Temperaturas
(máxima, media, mínima), precipitaciones, radiación solar global y
humedad relativa, tomada de la Estación Agrometeorológica de Paso Real
de San Diego, durante el período que duraron los experimentos
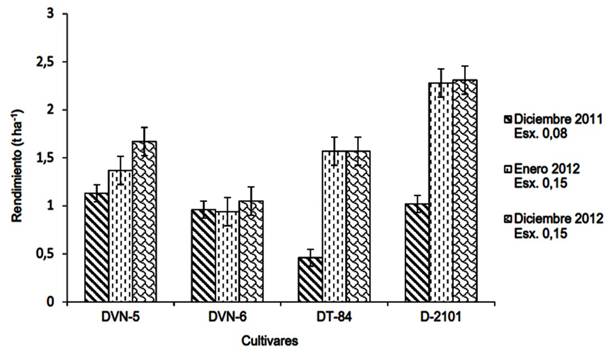
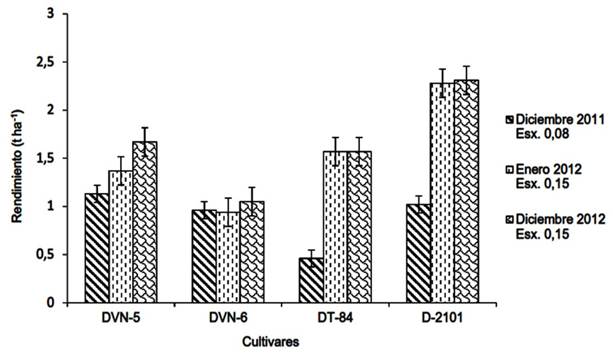
RESULTADOS Y DISCUSIÓNLos resultados del rendimiento agrícola aparecen en la Figura 2,
observándose una variación entre fechas de siembra y entre cultivares,
por lo que se comprobó que es difícil establecer un patrón de
comportamiento a partir del papel que juega la interacción con las
condiciones meteorológicas, a la hora de definir este indicador para un
cultivar determinado.
En las fechas de enero y
diciembre 2012 los cultivares (DVN-5, DT-84, D-2101) alcanzaron el mejor
comportamiento, con diferencias estadísticamente significativas con
respecto a la siembra de diciembre 2011. El cultivar DVN-6 mostró
diferencias en el comportamiento de esta variable entre fechas; sin
embargo, DT-84 fue el de menor rendimiento en la fecha de diciembre
2011.
Rendimiento agrícola (t ha-1) al 14 % de humedad de los cultivares de soya sembrados en las tres fechas en estudio
Esta variabilidad de los cultivares en
distintas fechas de siembra puede estar relacionada a la respuesta de
estos al comportamiento de las variables meteorológicas, las cuales
juegan un papel fundamental en la productividad del cultivo 14. Al respecto cabe destacar que las temperaturas en las fechas de diciembre y enero 2012 (Figura 1),
fueron relativamente superiores a las de diciembre 2011, por lo que
este resultado corrobora lo planteado por algunos autores, dónde afirman
que el rendimiento en el cultivo de la soya se ve influenciado durante
todo el ciclo por las temperaturas 15.
También,
otros estudios realizados con el fin de explicar la variabilidad del
rendimiento en el cultivo de la soya, basan su principio en que las
variaciones en los rendimientos de este cultivo puede ser consecuencia
de la diferente disponibilidad de radiación 16. Esto puede ser la causa de que el cultivar DT-84, a pesar de ser recomendado para la época de frío (Tabla 2),
muestre los menores valores del rendimiento en diciembre 2011, ya que
en esta fecha donde se registraron los valores más bajo de radiación
solar (Figura 1). En Cuba los rendimientos agrícolas varían significativamente entre las épocas y fechas de siembra 10.
En este sentido, trabajos realizados en otros cultivos demuestran que
el rendimiento se relaciona positiva y linealmente con la fecha de
siembra, dependiendo del cultivar y el ambiente 17.
Al analizar el comportamiento de los principales componentes del rendimiento (Tabla 3),
se pudo evidenciar las diferencias de estas variables, tanto entre
cultivares como entre fechas de siembra. En cuanto a la masa de los
granos, los cultivares alcanzaron los valores más altos en la fecha de
diciembre 2011 y más bajo en las fechas de enero y diciembre 2012, dónde
se muestran los mejores rendimientos. Esta contradicción que existe
entre el rendimiento y sus componentes puede estar dada por el carácter
compensatorio que tienen determinados cultivos en aumentar la masa de
sus granos cuando resulta bajo el número de vainas y granos. (18).
Con respecto al número de granos, los
cultivares alcanzaron la mejor respuesta en las fechas de siembra donde
se obtuvieron los valores más altos del rendimiento, por lo que este
componente debió alcanzar un papel fundamental en la determinación del
rendimiento agrícola. Algunos estudios han demostrado que en un amplio
rango de condiciones agronómicas, el número de granos es el componente
que mejor explica las variaciones en el rendimiento 19.
Por otra parte, al realizar el análisis de los cultivares de manera
independiente, es posible resaltar que en las tres fechas de siembra el
cultivar D-2101 alcanzó la mejor respuesta de esta variable, y además,
coincide con el alto valor del rendimiento alcanzado en las condiciones
edafoclimáticas en que se desarrollaron estos ensayos. Resultados
similares han sido alcanzados en otros estudios en Cuba, donde se
demuestra el excelente comportamiento de este cultivar en esta época 3.
El
comportamiento en el número de vainas fue similar al alcanzado en el
número granos, por lo que pudiera ser un elemento importante en la
formación del rendimiento, aunque algunos autores lo identifican como un
componente indirecto del rendimiento 15. Al respecto, en la literatura se destaca que el número de vainas es el primer componente a definirse en la etapa R3-R4,
y como el número de granos y la masa de los mismos, queda sujeto a las
fluctuaciones ocurrentes en el ambiente, de ahí la importancia de hacer
coincidir la etapa dónde se deciden estos componentes con las mejores
condiciones ambientales, aunque sea difícil de manejar en la práctica 20. Además, la soya tiene capacidad para fijar estructuras reproductivas por un largo período 21,
demostrándose en este estudio que una eventual disminución en el número
de vainas puede ser parcialmente compensada por un aumento en la masa
de los grano. Esto es importante siempre y cuando se señale que cada
componente es afectado con distinta intensidad por el ambiente en cada
etapa de desarrollo.
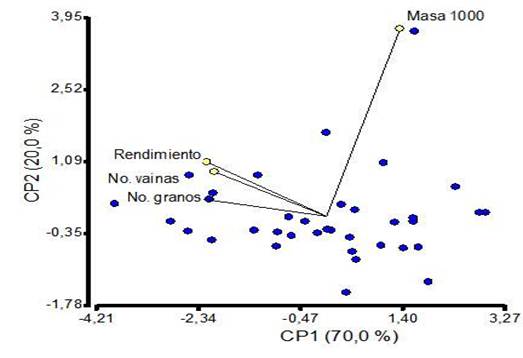
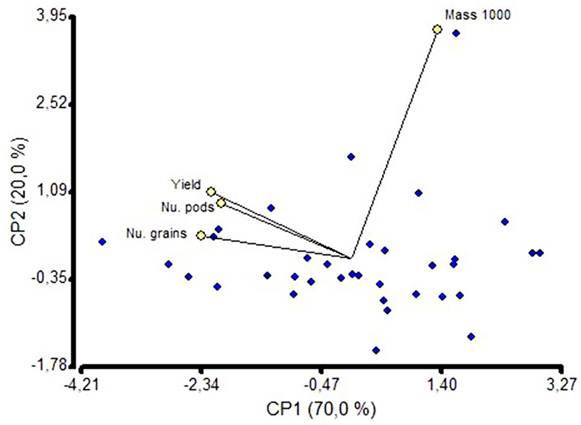
A partir de los resultados
en cuanto a la asociación del rendimiento agrícola y sus componentes, se
resolvió que las más influyentes fueron el número de granos/planta y el
número de vainas/plantas, vistas de forma general para las tres fechas
de siembra estudiadas. Esto se demuestra en el análisis de componentes
principales, donde las componentes 1 (CP1) y 2 (CP2), explicaron un 90 %
de la variabilidad total (Figura 3).
Asociación
del rendimiento agrícola de los cultivares de soya con de las variables
obtenidas sobre el primer y segundo componente en las tres fechas de
siembra estudiadas
Masa 1000: masa de mil granos (g). Rendimiento: Rendimiento agrícola (t ha-1). No. granos: Número de granos por planta. No. vainas: Número de vainas por plantas
La masa de los granos tuvo una alta
separación angular respecto al número de granos, número de vainas y el
rendimiento. Esto indica que bajo estas condiciones a medida que aumenta
el número de granos y el número de vainas disminuye la masa de los
mismos y viceversa, lo que se demuestra una vez más el nivel
compensatorio entre estas variables. Otros autores estudiaron la
asociación positiva y significativa del rendimiento y sus principales
componentes, donde pudieron confirmar que el número de granos y el
número de vainas son los componentes que más se asocian a la expresión
del rendimiento 22. Este tipo de análisis
fue seguido con tal acierto que quedó demostrado una vez más en estudios
realizados a cultivares de soya de diferentes grupos de madurez 16.
Por tanto, todo esto demuestra la posibilidad que distintos genotipos
puedan alcanzar rendimientos similares o distintos en un mismo ambiente,
y que un genotipo pueda tener distintos rendimientos en distintos
ambientes 5, sobre todo por la influencia
que pueda ejercer el comportamiento de las variables meteorológicas en
las etapas fenológicas donde se decidan cada uno de los componentes.
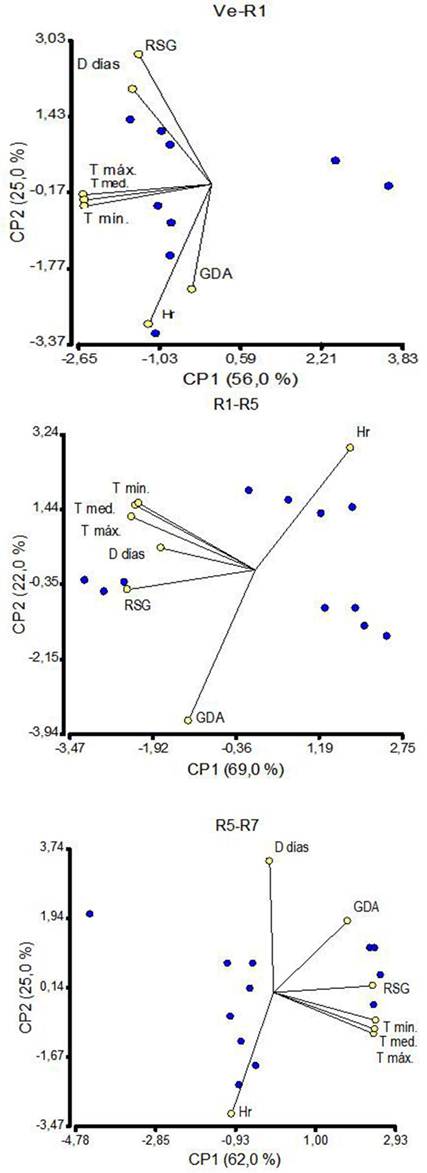
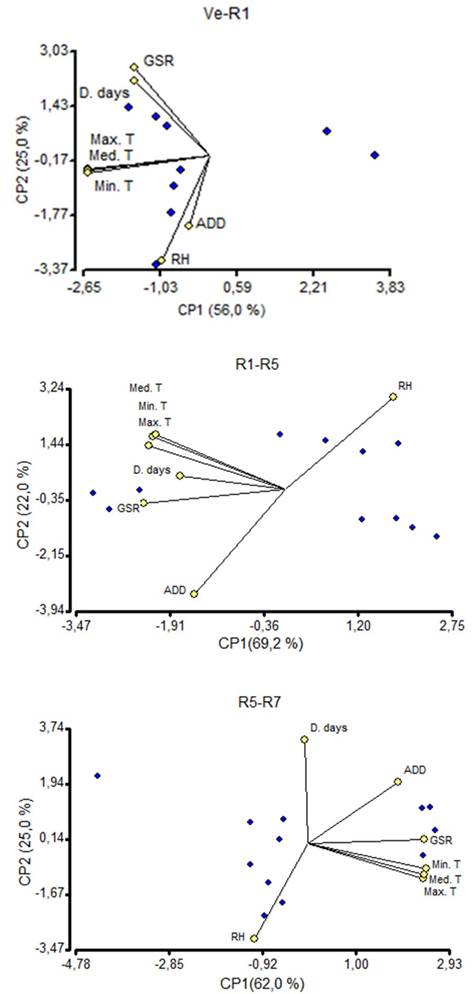
La
duración de las etapas fenológicas explica parcialmente la generación
de los componentes morfológicos del rendimiento, por tanto, al analizar
la asociación entre las diferentes variables meteorológicas con la
duración en días, en cada una de las etapas estudiadas para las tres
fechas de siembra en general, se evidenció las diferencias existentes
entre ellas (Figura 4).
En la etapa fenológica Ve-R1
(5-30 días después de la emergencia), la asociación más positiva con la
duración en días fue alcanzada por la radiación solar. Esto puede
contribuir a que se estimule el crecimiento de la planta por una mayor
disponibilidad de radiación solar. Al respecto, algunos autores afirman
que una mayor eficiencia de intercepción de radiación en esta etapa,
estimula una mayor tasa de crecimiento del cultivo que se traduce en un
incremento en el número de nudos, y por ende en el número de vainas y en
el rendimiento 23. Sin embargo, el alto
número de vainas que lograron los cultivares estudiados en las fechas de
siembra de enero y diciembre 2012, coincide con los mayores valores de
radiación solar que esta etapa llegó a alcanzar.
Asociación
de las principales variables meteorológicas con la duración en días de
los cultivares de soya en cada una de las etapas fenológicas estudiadas
para las tres fechas de siembra en general
D días: duración en días (días). GDA: grados días acumulados (0 C). RSG: radiación solar global (MJ.m-2). T mín: temperatura mínima (0 C). T med: temperatura media (0 C). T máx: temperatura mínima (0 C). Hr: humedad relativa (%)
Por otra parte, la asociación más clara a la duración en días en la etapa fenológica R1-R5
(30-45 días después de emergencia), estuvo dada por la radiación solar y
las temperaturas. Esto debe estar relacionado con el hecho de que en la
fecha de diciembre 2011, se hayan obtenido un bajo número de granos, ya
que la temperatura media en esta etapa (etapa donde se decide el número
de granos), mantuvo valores por debajo de los 25 0C. se ha
planteado en la literatura que los cultivares de soya pueden presentar
un comportamiento diferente en cuanto a las temperaturas, sin embargo,
algunos resultados han mostrado que, para aumentar el número de granos
por unidad de superficie, se necesitan temperaturas medias diarias
superior a los 26 ºC (6,24). Sin embargo, otros autores plantean que
estrés por temperaturas al final del período crítico del cultivo (R5), (superiores a 30 0C),
pueden modificar la estabilidad de las células de las membranas, lo
cual afecta varios procesos metabólicos, en particular la fotosíntesis y
la respiración celular 25, a la vez que podrían generar una disminución en la masa de los granos 6.
Acerca
de la asociación de la radiación solar con la duración en días de esta
etapa, algunos estudios destacan la importancia que tiene la influencia
de la misma durante el periodo crítico del cultivo (R1-R5),
convirtiéndose en una característica relevante debido a que el ambiente
de producción durante esta etapa, condiciona la tasa de crecimiento del
cultivo, determinándose el número de granos como componente principal
del rendimiento 26. El fundamento de esta hipótesis data en que la radiación solar tiene una alta asociación positiva con el número de granos/m2 (15.
En cuanto a la fase R5-R7,
no existió asociación alguna con las variables estudiadas, por lo que
en este caso no es posible establecer un patrón de comportamiento. Al
respecto existen contradicciones en muchos estudios, ya que algunos
autores plantean que la tasa de desarrollo luego de R5 resulta más afectada por el fotoperiodo que por los cambios en la temperatura y radiación 23.
Sin embargo, otros autores manifiestan que las condiciones
prevalecientes en cuanto humedad, temperatura y radiación solar son de
vital importancia en esta fase, pues los cultivares de alto número de
granos combinan estas variables de manera diferente, determinando
distintas estrategias fisiológicas igualmente exitosas 27.
También se establece que la temperatura generalmente tiene una
influencia positiva en la proporción de desarrollo de la cosecha, lo que
significa que todas las cosechas y todas las fases de desarrollo son
sensibles a la temperatura 6. No puede
descartarse que, a partir de estudios que clarifiquen estos aspectos,
puedan identificarse nuevos genotipos que permitan realizar un mejor
análisis de la relación existente entre la fenología y las condiciones
ambientales como factor de variabilidad, abriendo nuevas rutas para
incrementar el rendimiento del cultivo de soya.
CONCLUSIONES
Sobre
la base de los resultados se puede concluir que los mayores valores del
rendimiento agrícola se encontraron en la fecha de diciembre 2012,
aunque de manera general el cultivar D-2101 fue el de mejor
comportamiento en todas las fechas de siembra estudiadas.
El
número de granos/planta y el número de vainas/planta fueron los
componentes que más influyeron en la expresión del rendimiento.
De
las variables meteorológicas estudiadas, demostraron ser las más
influyentes en la duración de las etapas, la radiación solar en la etapa
Ve-R1, R1-R5, y las temperaturas en la etapa R1-R5.
Las
radiación y la temperatura desempeñan un importante papel en la
formación del rendimiento, por su influencia en la determinación de la
masa y el número de granos. La duración en días de la etapa fenológica R5-R7 no estuvo asociada a ninguna de las variables meteorológicas analizadas.
INTRODUCTIONSoybean (Glycine max
(L.) Merrill) is the most cultivated oilseed and the fourth most
produced grain after corn, wheat and rice. The world produces an average
of 176.6 million tons of soybeans per year over a surface area of 75.5
million ha 1, with the United States,
Argentina and Brazil accounting for 80 % of this volume, which explains
why America is the continent with the highest production worldwide with
85.32 %, followed by Asia, which represents 12.78 % 2. Despite the fact that in Cuba, soy is known since the beginning of the 20th
century, it has not yet been possible to stabilize its production,
since around 20,000 hectares are planted and only 35 % of the national
demand is satisfied that forces the country to import some 600,000 tons
per year 3.
However, soybeans are subject to many abiotic stresses that reduce their yield 4,
as do most economically important crops, because in order to achieve
stable yields over time or increase them, it is important to take into
account the interaction between genotypes and the environment (climate,
soil and management practices). It is possible that any variable that
produces effects on the environment in crop productivity will be
reflected (5. In works carried
out in order to address the stability of yield in different soybean
cultivars, it has been determined that even in high production
sustainable systems; there is great variability of it. Therefore, in
order to achieve high yields, it is necessary to select those cultivars
that have a high average productivity (adaptation) and to know their
probable variation between environments (stability) 6).
Similarly, several investigations worldwide assess the incidence of climate in relation to the planting date 7.
This aspect is important to point out, because most of the
meteorological variables, such as temperatures and solar radiation,
affect the growth and development of crops positively or negatively,
while modifying their environment and altering the production of both
dry matter as the yield 8.
In
correspondence with the above criteria, it is necessary to know the
main factors that cause variability in the yield of the soybean crop, so
the present work with the objective of evaluating the variability of
yield in soybean cultivars (Glycine max (L.) Merrill) associated with meteorological variables according to the sowing date in the cold season was developed.
MATERIALS AND METHODSThe
experiments were carried out at the Base Scientific and Technological
Unit, Los Palacios (UCTB-LP), belonging to the National Institute of
Agricultural Sciences, located on the southern plain of Pinar del Río
province of, at 22 ° 44 'North latitude. and at 83 ° 45 'West latitude,
at 60 m asl, with an approximate slope of 1%. Four soybean cultivars of
Vietnamese origin (DVN-5, DVN-6, DT-84, D-2101) were evaluated, which
were sown on three different sowing dates; December 2011, January 2012
and December 2012, corresponding to the cold season.
The soil of the experimental area is classified, according to the New Version of Genetic Classification of Soils of Cuba 9,
as Hydromorphic Gley Nodular Ferruginous Petroferric. As results of the
soil sampling of the experimental area, some properties that
characterize its fertility are shown (Table 1).
The main characteristics of the cultivars under study are presented in Table 2
3, which were sowed by direct seeding
at a distance (manual), of 0.70 m between rows and 0.07 m between
plants, with a standard of 54 kg ha-1 of seeds. The phytotechnical work was carried out as recommended in the Technical Manual of Soybean Cultivation 10.
An experimental randomized block design was used with four treatments
(the cultivars) and three replications. The experimental plots had an
area of 30 m2.
Figure 1 shows the maximum, minimum and average
daily temperature (T max, T min, T ave), precipitation, global solar
radiation (RSG) and relative humidity (Hr), from the period in which the
experiments lasted, which were obtained from the Paso Real
meteorological station of San Diego, in Los Palacios.
The thermal sum or cumulative day degrees (GDA) was calculated by the following method 11:
Where in this case was selected as the base temperature at 10 ° C and n the number of days in the period considered.
In
each experimental plot at the time of harvest, ten representative
plants were taken at random, always respecting the edge area and were
determined:
Agricultural yield (t ha-1, adjusted to 14% humidity) (Yld).
Number of pods per plant (Nu pods).
Number of grains per plant (Nu grains).
Mass of 1000 grains (Mass 1000).
To determine the agricultural yield, 8 m2
of the center were harvested in each experimental plot, the plants were
threshed and the grains were dried until they reached 14 % humidity.
Regarding the number of grains and number of pods, the value of each
variable in the ten plants per plot was counted.
The
three sowing dates were climatically characterized through a principal
components analysis with said variables, dividing the crop cycle into
three periods: Ve-R1, pre-flowering stage and beginning of flowering; R1-R5, early reproductive stage in which most of the fruits are established and seeds begin to fill, and the third stage is R5-R7, period of seed filling 12.
The
means of the evaluated variables obtained by cultivating and date of
sowing, were subjected to analysis of variance (ANOVA), and the
significant differences between the means were determined with the
Fisher LSD test (p <0.05). Several matrices of data were constructed
which were processed by the multivariate technique of Principal
Components, by means of the representation of a Biplot. The statistical
package InfoStat version 2015 was used 13.
Temperatures
(maximum, average, minimum), rainfall, global solar radiation and
relative humidity, taken from the Paso Real Agrometeorological Station
of San Diego, during the period of the experiments
RESULTS AND DISCUSSIONThe results of the agricultural yield appear in Figure 2,
observing a variation between dates of sowing and between cultivars, so
it was found that it is difficult to establish a behavior pattern from
the role played by the interaction with weather conditions, to the time
to define this indicator for a particular cultivar.
On
the dates of January and December 2012 the cultivars (DVN-5, DT-84,
D-2101) reached the best performance, with statistically significant
differences with respect to the sowing of December 2011. The cultivar
DVN-6 showed differences in the behavior of this variable between dates,
however, DT-84 was the lowest performance on the date of December 2011.
Agricultural yield (t ha-1) at 14 % humidity of soybean cultivars sown in the three dates under study
This variability of the cultivars in the
different sowing dates can be related to the response of these to the
behavior of the meteorological variables, which play a fundamental role
in the productivity of the crop 14. In this regard, it should be noted that the temperatures on the dates of December and January 2012 (Figure 1),
were relatively higher than those of December 2011, so this result
corroborates what was stated by some authors, where they affirm that the
yield in the cultivation of soybeans are influenced during the whole
cycle by temperatures (15.
Also,
other studies carried out with the purpose of explaining the
variability of yield in soybean cultivation, base their principle on the
fact that variations in the yields of this crop may be a consequence of
the different availability of radiation 16. This may be the reason why the cultivator DT-84, despite being recommended for the cold season (Table 2), shows the lowest yield values in December 2011, since on this date where the lowest values were recorded of solar radiation (Figure 1).
In Cuba, agricultural yields vary significantly between seasons and
sowing dates (10). In this sense, works carried out in other crops show
that the yield is positively and linearly related to the sowing date,
depending on the cultivar and the environment 17.
Also,
other studies carried out with the purpose of explaining the
variability of yield in soybean cultivation, base their principle on the
fact that variations in the yields of this crop may be a consequence of
the different availability of radiation 16. This may be the reason why the cultivator DT-84, despite being recommended for the cold season (Table 2), shows the lowest yield values in December 2011, since on this date where the lowest values were recorded of solar radiation (Figure 1). In Cuba, agricultural yields vary significantly between seasons and sowing dates 10.
In this sense, works carried out in other crops show that the yield is
positively and linearly related to the sowing date, depending on the
cultivar and the environment 17.
When analyzing the behavior of the main components of yield (Table 3),
it was possible to demonstrate the differences of these variables, both
between cultivars and between sowing dates. Regarding the mass of the
grains, the cultivars reached the highest values on the date of December
2011 and lower on the dates of January and December 2012 where the best
yields are shown. This contradiction that exists between the yield and
its components can be given by the compensatory character that certain
crops have in increasing the mass of their grains when the number of
pods and grains is low 18.
With respect to the number of grains, the
cultivars reached the best responses in the sowing date where the
highest value of yield were achieved for this reason this component
should have a main role in the determination of agricultural yield. Some
studied has showed that a wide range of agroeconomic conditions, the
number of grains is the best component that explain the yield variations
19. On the other hand, when analyzing the
cultivars independently, it is possible to highlight that in the three
sowing dates the cultivar D-2101 reached the best response of this
variable and it coincided with the highest value of yield reached in
edaphoclimatic conditions where these experiments took place. Similar
results in other studies in Cuba have been obtained where an excellent
behavior of this cultivar during this season 3.
The
behavior in the number of pods was similar to the number of grains that
is an important element in the formation of yield, although some
authors identify it like an indirect component of yield 15. In literature is highlighted the number of pods is the first component to define in the R3-R4
stage. As the number and mass of grains is in correspondence with the
fluctuations in the environment from this the importance of making to
coincide the stage, in which these components with the best
environmental conditions although it will be hard to manage at practice
are decided 20.
Besides, soy has the capacity to fix reproductive structures for a long time 21,
showing in the study that an eventual decreasing in the number of pods
can be balanced partially, for an increasing in the grain mass. It is
important if each component could be affected with different intensity
for the environment of each development stage.
From
the results related to the association of agricultural yield and its
components, it was determined that the most influent were the number of
grains/plant and the number of pods/plants, in general form to the three
sowing dates studied. It is presented in the analysis of main
components where the components 1 (CP1) and 2 (CP2) explained 90 % of
the total variability (Figure 3).
Association
of the agricultural yield of soy cultivars with the obtained variables
on the first and second component in the three sowing dates studied
Mass 1000: mass of 1000 grains (g). Yield: Agricultural yield (t ha-1). Nu. grains: Number of grains per plants. Nu. pods: Number of pods per plants
The mass of the grains had a high angular
separation respect to the grain and pod number and yield. It indicates
that under these conditions while increase the number of pods and grains
decrease mass of the same ones and vice versa, what it is appreciable
again the compensatory level among these variables. Other authors
studies the positive and significant association of yield and its main
components where it could be to appreciate that the number of grains and
pods are the components, which are associated to yield 22. This type of analysis was exposed in soy cultivars one more time in studies, of different maturity groups 16.
Furthermore, all this offer the possibility of many and different
genotypes can reach similar yields in the same environment, and a
genotype can have different yields in different environments 5,
overall for the influence that can exerted in the behavior of
meteorological variables in the phenological stage where each one of the
components are decided.
The duration of
phenological stages, explain partially the morphological component
generation of yield, then when analyzing the association among the
different meteorological variables with the duration in days, in each
one of the studied stages for the three sowing dates in general, the
existent differences among them (Figure 4)
In the phenological Stages Ve-R1
(5-30 days after emergence), the most positive association with the
duration in days for solar radiation were reached. It should contribute
to the stimulation of plant growing for a greater availability of solar
radiation.
About this, some authors express that a
higher efficiency of the radiation in this stage, stimulate a greater
rate of crop growing that can be appreciated in an increasing in the
number of nods and then in the number of pods and yield 23.
However, the amount of pods achieved by the cultivars studied in the
sowing dates in January and December 2012, coincide with the greater
values of solar radiation of this stage.
Association
of the main meteorological variables with the duration in days of the
cultivars of soy in each one of the phenological stage studied for the
three sowing dates in general
D days: duration in days (days). GDA: degree accumulate days (0 C). RSG: global solar radiation (MJ.m-2). T min: minimum temperature (0 C). T med: Mean temperature (0 C). T max: maximum temperature (0 C). Hr: relative humedity (%)
On the other hand, the clearest association
to the duration in days in the phenological stage R1-R5 (30-45 days
after emergence), was given by solar radiation and temperatures. This
must be related to the fact that on the date of December 2011, a low
number of grains was obtained, since the average temperature in this
stage (stage where the number of grains was decided), kept values below
the 25 0C. It has been suggested in the literature that
soybean cultivars may exhibit a different behavior in terms of
temperatures, however, some results have shown that, in order to
increase the number of grains per unit area, average daily temperatures
higher than the average 26 ° C 6,24.
However,
other authors state that stress by temperatures at the end of the
cultivation critical period (R5) (higher than 30 °C) can modify the
stability of the cells of the membranes, which affects several metabolic
processes in particular photosynthesis and cellular respiration 25, at the same time that they could generate a decrease in the mass of the grains 6.
About
the association of solar radiation with the duration in the days of
this stage, some studies highlight, the importance that have the
influence of the same during the critical period of crop (R1-R5),
close
to the association of solar radiation with the duration in days of this
stage. Some studies highlight the importance of the influence of the
same during the critical period of the crop becoming a relevant
characteristic because the production environment during this stage ,
conditions the growth rate of the crop, determining the number of grains
as the main component of yield 26. The basis of this hypothesis is that solar radiation has a high positive association with the number of grains / m2 (15.
As
for phase R5-R7, there was no association with the variables studied,
so in this case it is not possible to establish a pattern of behavior.
There are contradictions in many studies, since some authors suggest
that the rate of development after R5 is more affected by the
photoperiod than by changes in temperature and radiation 23.
However, other authors state that the prevailing conditions in terms of
humidity, temperature and solar radiation are of vital importance in
this phase, since cultivars with a high number of grains combine these
variables in different ways, determining different physiological
strategies that are equally successful 27.
. It is also established that temperature generally has a positive
influence on the rate of development of the crop, which means that all
crops and all stages of development are sensitive to temperature 6.
It cannot be ruled out that, based on studies that clarify these
aspects, new genotypes can be identified that allow a better analysis of
the relationship between phenology and environmental conditions as a
variability factor, opening new routes to increase crop yield. soy.
About
the association of solar radiation with the duration in days of this
stage some studies highlight, the importance that have the influence of
the same during the critical period of crop (R1-R5),