Translate PaperArtículo original

Dosis y frecuencia de fertilizante mineral para el establecimiento de plantaciones de pinares en suelos ácidos

  [*] Autor para correspondencia: investigacion4@eetsj.co.cu


RESUMEN

En Cuba existen pocos estudios encaminados a recomendar dosis y frecuencia de fertilizante mineral NPK para el establecimiento de plantaciones forestales, estas se usan de forma incorrecta sin tener en cuenta las consecuencias negativas que puede acarrear su aplicación tanto en exceso como en defecto. Por ello, la presente investigación estudió la respuesta de diferentes dosis y frecuencia de la fertilización mineral aplicada de forma fraccionada durante los primeros cinco años de establecida una plantación de Pinus caribaea. La investigación se realizó en la Estación Experimental Agroforestal de Viñales, Pinar del Río, Cuba. Se investigó diferentes dosis y frecuencias de NPK, a partir de un diseño de bloques al azar. Se establecieron siete tratamientos diferenciados por las dosis de NPK y regímenes de aplicación, más un tratamiento testigo sin fertilización. Se hicieron mediciones de altura y diámetro en diferentes edades con las cuales se determinó el volumen y se le dio seguimiento durante 41 años, y se estimaron las funciones de crecimiento mediante regresión multinivel para todo el período se determinó que la aplicaciones de 600 g árbol-1, 800 g árbol-1 y 1000 g árbol-1 en régimen alterno o continuo de (NPK) fueron superiores con respecto al testigo; el tratamiento de la aplicación de una dosis única de 300 g árbol-1 de (NPK) provocó valores inferiores con respecto al testigo.

Palabras clave:
fertilización mineral; cantidad; frecuencia; rendimiento.

INTRODUCCION

Los efectos beneficiosos que ejercen los fertilizantes sobre la biología de las plantas son bien conocidos. Sin embargo, su aplicación incorrecta, tanto en exceso como en defecto, puede acarrear consecuencias negativas 1.

En Cuba, en la rama forestal y a nivel de producción, el uso de fertilizantes químicos es mínimo y su dosificación deja mucho que desear pues, en el mejor de los casos, se emplea tentativamente, aun antes de estudios e investigaciones.

Una conífera autóctona de Cuba es Pinus caribaea var. caribaea. Por su alta plasticidad ecológica y rápido crecimiento - entre los pinos cubanos - ha sido utilizada ampliamente en los planes de reforestación en todo el archipiélago cubano. Este árbol, crece naturalmente en suelos poco fértiles 1.

Sin embargo, las plantaciones establecidas en suelos Alíticos de Baja Actividad Arcillosa Rojo y Rojo Amarillento de la provincia de Pinar del Río, que originalmente constituyeron su hábitat y que fueron marginadas posteriormente por la agricultura, en general, no corresponden con el potencial productivo de la especie, debido a bajos incrementos medios anuales de volumen maderable 1.

Uno de los períodos más críticos para el desarrollo de las plantaciones forestales es el establecimiento, durante el cual existe una demanda nutritiva creciente. Por ello, durante dicho periodo, la fertilización y el control de malezas se utilizan como prácticas silviculturales 2.

La fertilización estimula el crecimiento de los árboles y los hace más competitivos frente a las malezas, lo cual no impide realizar un control adecuado de estas 3. La acción combinada de estas dos prácticas debiera provocar un mejor crecimiento de los árboles; sin embargo, los resultados difieren dependiendo de las condiciones de cada sitio, como se ha observado en Pinus radiata D. Don 4,5.

Durante la década de los 70 se establecieron una serie de experimentos de fertilización en todo el país, en la Estación Experimental Agroforestal de Viñales, en un suelo Alítico de Baja Actividad Arcillosa. En este orden de ideas, se estableció un experimento de fertilización mineral que contemplaba aplicaciones fraccionadas de NPK con el objetivo de determinar las mejores dosis y frecuencias de fertilizante mineral NPK para obtener altos rendimientos en volumen de madera con corteza en plantaciones establecidas en estos suelos.

MATERIALES Y METODOS

El experimento se estableció en la Estación Experimental Forestal de Viñales que se encuentra ubicada entre los 22º 37´ longitud norte y los 83º 41´ longitud Oeste y a una elevación de 150 m s.n.m 6.

Al inicio de la plantación los valores de temperatura fueron tomados de la Estación Meteorológica más cercana perteneciente a la ciudad de Pinar del Río según los cuales la temperatura media anual es de 24,7 ºC y la máxima diaria de 28,7 ºC, la mínima diaria de 20,4 ºC y la mínima absoluta de 16,2 ºC 7.

Se evaluó la respuesta a la fertilización en altura, diámetro y volumen a los 35 y 41 años 5, se comparan los diferentes tratamientos mediante ANOVA partiendo de un diseño de bloques al azar, 6 estudiaron la respuesta en altura y diámetro durante todo el período que duró el experimento, los resultados fueron evaluados mediante la determinación de curvas de crecimiento con el uso de la modelación multinivel. Se trabajó con los mismos datos empleados en estos artículos para determinar las dosis y las frecuencias de fertilizante mineral NPK más adecuadas para obtener volúmenes de madera superiores a la no aplicación de fertilizante, utilizando curvas de crecimiento en volumen mediante la modelación multinivel.

Diseño experimental

El experimento da continuidad a una serie de mediciones realizadas sobre los mismos árboles desde el año 1971, por un grupo de autores 8, a un ensayo de fertilización diseñado en bloques al azar con cuatro réplicas y ocho tratamientos, establecido por la Estación Experimental Forestal de Viñales que contemplaron aplicaciones fraccionadas de NPK con fórmula 8-10-10 (Tabla 1), se probaron cuatro dosis de fertilizante mineral NPK 300, 600, 800 y 1 000 g árbol-1, con dos frecuencias de aplicación en años alternos y continuos.

El fertilizante (NPK) se aplicó en surcos, en forma de media luna, alrededor de las plántulas. Estas fueron plantadas según el método de hoyo, la misma se aplicó a inicios del período lluvioso en el mes de julio durante los cinco primeros años de establecida la plantación. La procedencia de las semillas fue de la masa semillera Marbajitas. El marco de plantación fue de 3 x 3 m. El tamaño de las parcelas fue de 225 m2 con un total de 25 árboles y nueve en la parcela útil. Los árboles de la parcela útil fueron etiquetados y se dio seguimiento durante todo el período que duró el ensayo.

El experimento se estableció en el año 1971 por la Estación Experimental Forestal Viñales y las aplicaciones de fertilizantes comenzaron en este año hasta 1976.

El suelo en el cual se estableció la plantación está clasificado como Ultisols 9 y clasifica como un Alisol y Alítico de Baja Actividad Arcillosa 10,11, con pendientes del 4,3 %, derivados de esquistos cuarcíticos y pizarras. La profundidad total del suelo es de 1,15 m; pero, debido a la acumulación de arcilla en el horizonte B y al drenaje interno deficiente, factores que limitan la penetración de las raíces, la profundidad efectiva es de 20 cm 1.

Mediciones dasométricas

Para evaluar la respuesta de la especie a la fertilización se calculó la cantidad de árboles vivos ha-1, se midió la altura y el diámetro a 1,30 cm del suelo de los árboles de la parcela útil, con hipsómetro y forcípula, respectivamente.

Se cuentan con mediciones desde el año 1973 a la edad de dos años de los árboles hasta 2012 (41 años de edad), este trabajo estudia el comportamiento de las principales variables dasométricas ante las diferentes dosis y frecuencias del fertilizante mineral aplicado.

Los árboles vivos ha-1: se estimaron a partir del número de árboles vivos en la parcela útil.

La altura se midió y evaluó a los 2, 6, 8, 15, 33, 35 y 41 años de edad de la plantación, la cantidad de árboles vivos ha-1 y el diámetro a los 6, 8, 15, 33, 35 y 41.

Altura (h): se realizaron con regla graduada hasta los dos años de la plantación y con hipsómetro de, Blume - Leiss, cuando sobrepasaban los cinco metros.

Diámetro (d): con forcípula graduada a 1,30 m del suelo.

Los volúmenes de madera correspondientes a cada una de las parcelas se calcularon sumando los volúmenes de los árboles sobrevivientes, de esa manera los volúmenes valorados reflejaron los cambios en la cantidad de árboles vivos por hectárea, los cuales fueron estimados a partir de los seis años de edad y se calcularon, teniendo en cuenta la cantidad de árboles vivos por hectárea, por la fórmula de Hubert:

donde:

  • V - volumen de madera por árbol, m3 árbol-1

  • D1.30 - diámetro a 1,30 m del suelo (cm)

  • h - altura (m)

  • Cf - coeficiente mórfico, (0,5 para P. caribaea)

Análisis estadístico

Para estimar el efecto de las diferentes dosis y la frecuencia del fertilizante mineral aplicado sobre el crecimiento de la variable volumen en árboles individuales se estimaron curvas de crecimiento con el uso de la modelación multinivel 12, se utilizó el programa MLwiN versión 2.02. Se definen dos niveles, las medidas repetidas constituyen el nivel 1 anidadas en los individuos, los árboles, nivel 2. El modelo multinivel general es el siguiente:

donde:

  • Y ij : valor de la variable resultado para el instante i en el individuo j

  • P variables explicativas Xp en el nivel 1 (p =1 P)

  • Q variables explicativas Zq en el nivel 2 (q=1 Q)

  • u 0j : efecto aleatorio del nivel 2

  • e ij : errores de nivel 1

Se asume que los errores e ij siguen una distribución normal con varianza σ2.

Se ajustan varios modelos para la variable respuesta volumen de madera, seleccionándose el mejor a partir de los valores de desvianza como indicador de calidad del ajuste. Se trabaja con un nivel de significación del 5 %.

Se ajustaron modelos de crecimientos jerárquicos donde la variable dependiente fue el volumen y las variables independientes la edad y los tratamientos.

Los tratamientos se introducen en el modelo como variables categóricas siendo la categoría de referencia el testigo (T1). Se utilizó el paquete estadístico Mini 2.1.

Se realizaron análisis univariados de la varianza y pruebas de comparaciones múltiples de Duncan y Bonferroni, para la variable incremento medio anual (IMA).

Análisis económico

Para el cálculo del beneficio económico solo se tuvo en cuenta el volumen de madera en m3 ha-1 a la edad de 41 años de la plantación (Tabla 2), el costo de los fertilizantes en CUP ($ 2 800,00), el costo de aplicación de fertilizante de $ 81,60 (CUP) y el valor del m3 de madera en bolo ($ 73,30) 13.

El beneficio económico se calculó por la fórmula:

donde:

  • Vn - volúmenes de madera para un tratamiento n

  • V0 - volumen de madera para el testigo

  • C - costo de la madera de pino en bolo (CUP. m3)

  • Cfer - costo de los fertilizantes (CUP t-1)

La relación Valor/Costo (V/C) se calculó por la siguiente expresión 14:

RESULTADO Y DISCUSIÓN

Para evaluar la respuesta a largo plazo a la fertilización mineral aplicada según el ensayo establecido, se mide el nivel de respuesta a partir de variables e indicadores que miden potencial productivo en cada uno de los tratamientos. Además, se establece la comparación entre los mismos, con énfasis en el contraste con el tratamiento testigo.

Respuesta a la fertilización expresada en volumen de madera con corteza

Todos los tratamientos con fertilizante mostraron diferencias significativas con respecto al tratamiento testigo, excepto el tratamiento T2 donde se aplicó una única dosis de fertilizante (Tabla 3) donde se asegura 15 que las coníferas necesitan nutrientes para crecer y cuando no los consiguen en niveles adecuados, presentan problemas con su desarrollo y crecimiento, debido a los desequilibrios nutrimentales que provoca la aplicación de dosis por debajo de los niveles requeridos 8.

El modelo 1 sin predictores solo estima el valor de la constante. El modelo 2 incluye la velocidad del crecimiento en volumen (coeficiente de la edad) y la aceleración de este crecimiento (coeficiente de edad al cuadrado) y el término edad al cubo. La inclusión de estos términos eleva significativamente la calidad del modelo con una disminución en la -2ll de 448,49. El modelo 3 incluye los tratamientos, además de los efectos del crecimiento, hay una mejoría significativa con respecto a los modelos 1 y 2 (diferencia en -2ll 470,89 y 22,4, respectivamente), no se aprecian diferencias significativas entre el tratamiento 2 y el testigo.

El modelo 4 resultó el de mayor poder explicativo, solo se incluyen las interacciones edad*tratamiento y los términos asociados al crecimiento. Las interacciones significativas indican que la velocidad del crecimiento en volumen con la edad depende del tratamiento a que se ha sometido la plantación.

El signo negativo del coeficiente de edad*T2, estadísticamente significativo, es un indicador de que, con este tratamiento, con el paso del tiempo el incremento en volumen es inferior al del tratamiento testigo que es la categoría de referencia.

Para los tratamientos T3, T4, T5, T6, T7 y T8, entre los cuales no existen diferencias significativas en el volumen medio, (Tabla 4), se obtuvo que la velocidad del crecimiento en volumen con la edad fue estadísticamente superior a la del tratamiento testigo.

La representación gráfica de los coeficientes de las variables asociadas a los tratamientos en el modelo 3 (Figura 1) muestra que los tratamientos T6, T7 y T8 a los que se aplicaron dosis de 800 y 1, 000 g árbol-1 de NPK en régimen alterno o continuo tuvieron mejores respuestas en volumen de madera en m3 ha-1 que el tratamiento testigo.

El tratamiento T2 al que se aplicó una dosis única 300 g árbol-1 mostró resultados inferiores para esta variable que el tratamiento testigo.

De forma general se observa que los tratamientos T6 (800 g NPK árbol-1 A), T7 (1, 000 g NPK árbol-1 C) y T8 (1 000 g NPK árbol-1 A) se sitúan en el grupo de los que mayores diferencias muestran con relación al testigo, el tratamiento T7 donde se aplicó (1 000 g NPK árbol-1) en años sucesivos resultó el tratamiento donde mayores valores se alcanzaron.

Otro autor plantea 16 que el efecto persistente por largos periodos de los fertilizantes aplicados a los árboles en sus primeros estadios de desarrollo, ha sido demostrado en diversas latitudes y se explica por el establecimiento del ciclo biogeoquímico después del cierre de las copas.

Al analizar el efecto de la fertilización mineral en el volumen correspondiente al tratamiento T2, los valores medios fueron inferiores al testigo en las últimas tres mediciones (como ocurre para la altura en el año 2004, 2006 y 2012 y para el diámetro en el 2004) 5,6. Esto demuestra que con la aplicación de forma racional de nutrientes se pueden obtener incrementos en los rendimientos.

Existen pocas evidencias de respuestas a la fertilización nitrogenada al establecimiento de P. radiata17; sin embargo, es común observar un mayor crecimiento y homogeneidad de la plantación al primer año de crecimiento, en suelos erosionados de primera rotación de este pino.

Respuestas diferenciadas que oscilan de 2 m3 ha-1 año-1 a 14,5 m3 ha-1 año-1, a la fertilización al establecimiento de plantaciones de P. radiata en diferentes sitios, a los cinco años de edad 18.

Estudios realizados donde ensayaron la fertilización con N y P en plantaciones de Pinus taeda con 240 kg ha-1 de N y 60 kg ha-1 de P en una dosis única (sin parcelamiento), y 60 kg ha-1 de N más 60 kg ha-1 de P, como fertilización en el momento de plantación y, luego de 2 años, se agregaron 180 kg ha-1 de N (fertilización en diferentes dosis hasta totalizar los 180 kg ha-1) 19.

Los autores verificaron luego de ocho años de mediciones, un aumento de 93 % en área basal y 39 % en volumen. Además, los autores concluyen que no hubo diferencias significativas entre las fertilizaciones únicas y en cuotas, a pesar de que la fertilización en cuotas es más interesante para no sobrecargar los costos iniciales de implantación de la plantación.

Incremento medio anual en volumen

Las pruebas de Shapiro Wilk dieron como resultado normalidad para todos los años con probabilidades superiores a 0,190 (Tabla 5). Los resultados de las pruebas de comparaciones múltiples de Duncan se observan en la (Figura 2) con el empleo de las primeras letras del alfabeto junto a las barras de error.

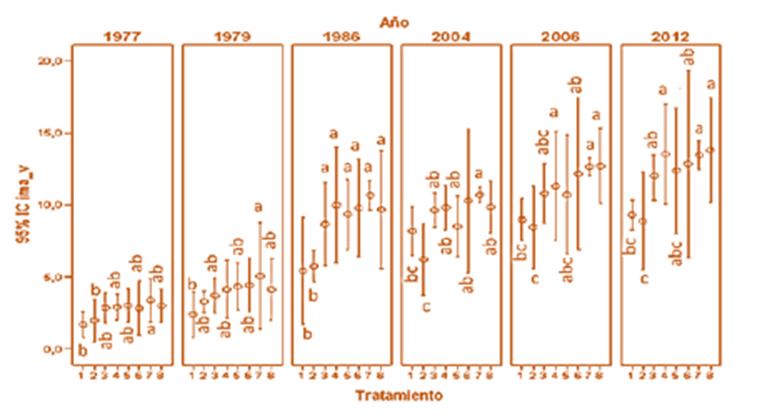
Al evaluar la evolución en el tiempo de los incrementos medios anuales de volumen según los diferentes tratamientos (Figura 2), se determina un incremento del volumen superior a los 3,97 m3 ha-1 año-1 con relación al tratamiento T1 y T2.

En este último donde se aplicó la dosis más baja de fertilizante demostró que la adición de una pequeña cantidad de fertilizante solo en el primer año de vida, no es efectiva para el alcance de volúmenes óptimos, coincidiendo con los resultados obtenidos 1 quienes manifiestan que cuando se realiza una sola fertilización inicial en los suelos Alíticos de baja actividad arcillosa no hay respuesta a la fertilización.

En el año 2004 los incrementos medios anuales de volumen correspondientes al tratamiento T2 fueron inferiores al testigo. Se observó que las dosis más altas de fertilizantes aplicadas en años sucesivos o alternos permiten los incrementos de volúmenes más altos, tal como ocurrió para la altura y el diámetro (5,6) ; El tratamiento T7 (1 000 g NPK árbol-1) causó los mayores efectos en este indicador de crecimiento.

Se recomienda la aplicación de 1 800 g NPK árbol-1 (20, fraccionados en cuatro aplicaciones en años continuos, en un experimento establecido en la misma zona de estudio. Los resultados obtenidos en el presente trabajo indican: i) que la aplicación fraccionada de NPK (fórmulas completas) en años alternos o continuos permite aumentar los rendimientos apreciablemente, y ii) la aplicación de fórmulas completas es más conveniente.

Los incrementos medios anuales en volúmenes promedio fueron diferentes significativamente en los tres últimos años de evaluación (Figura 2). En todos los años evaluados, los tratamientos donde se aplicaron dosis de fertilizante superiores a los 300 g árbol-1 permitieron obtener incrementos en volúmenes superiores con respecto al T2, de igual forma se comportó el tratamiento testigo donde a pesar de no existir diferencias significativas con el T2 sus valores medios fueron superiores en 12,3; 4,4 y 3,6 % en los últimos tres años respectivamente.

En todos los años el tratamiento T7 donde se aplicó una dosis 1 000 g NPK árbol-1 en años sucesivos fue el de mejor comportamiento, con diferencias apreciables con relación al testigo y al T2, exceptuando el año 1979 donde no hubo diferencias entre los tratamientos T2 y T7, otro autor coincide y plantea que un mal manejo de la dosis correcta, la fuente, del momento, o de la ubicación del fertilizante (N), y la falta de un balance apropiado con otros nutrientes esenciales pueden incrementar la pérdida total de N 21.

Análisis económico

Los tratamientos T3, T4, T5, T6, T7 y T8 reportaron efectos económicos positivos, excepto el tratamiento T2 donde se aplicó una dosis mínima de 300 g árbol-1, en la Figura 3 se presentan las diferencias en beneficio económico y la relación valor / costo de los tratamientos con respecto al testigo. Las ganancias para los tratamientos del T3 al T8 están por encima de los $ 6 000 ha-1, destacándose el tratamiento T8 con la mayor ganancia, superior a los $ 9 992 ha-1, las pérdidas ocasionadas en el tratamiento T2 fueron inferiores a $ 2 300 ha-1 a los 41 años de edad de la plantación y las relaciones V/C para los tratamientos T3, T4, T5, T6, T7 y T8 fueron superiores a dos, valor que, según recomienda 14, es aceptable para una inversión en fertilización.

De forma general los tratamientos T3, T4, T6, T7 y T8 fueron los de mejores resultados alcanzados destacándose el T8 con un beneficio económico superior a los $ 9 992 ha-1 y una relación valor/costo superior a 2,5. Es importante resaltar que el tratamiento T7 se ha comportado como el más estable en todas las variables evaluadas durante todo el proceso de desarrollo de este trabajo en el análisis económico, a pesar de obtener una relación valor/costo de 2,5 inferior a otros tratamientos, su beneficio económico es superior a los $ 8 000 ha-1. Cualquiera de estas últimas variantes representa una opción atractiva para el manejo silvícola, en dependencia del fertilizante que se disponga y del uso al que se destine la madera, en aras de obtener el máximo de rendimiento en volumen, así como las mayores ganancias y la mejor relación valor/costo 22.

CONCLUSIONES

  • Los resultados que se presentan tienen repercusión para la práctica productiva pues constituyen una vía ecológicamente sostenible y económicamente viable para obtener producciones de madera mayores, en tiempo y espacio menores.

  • Las dosis de fertilizante mineral de 600 g árbol-1, 800 g árbol-1 y 1 000 g árbol-1 permitieron obtener volúmenes de madera con corteza superiores al tratamiento testigo, el tratamiento donde se aplicó una única dosis de 300 g árbol-1 resulto el tratamiento de más bajos rendimientos inferiores a los alcanzados por el tratamiento testigo.

  • Los tratamientos del T3 al T8 fueron los de mayor beneficio económico con una relación valor/costo igual o superior a 2,5.

RECOMENDACIONES

  • Aplicar 1 000 g árbol-1 de fertilizante mineral (NPK) de forma continua, fraccionada en dosis de (200, 200, 400 y 200 g árbol-1 en los primeros cuatro años) para el establecimiento de plantaciones de P. caribaea en los suelos ácidos en Pinar del Río.

  • Aplicar para el establecimiento de plantaciones forestales, las dosis de 600 g árbol-1, 800 g árbol-1 o 1 000 g árbol-1 de fertilizante mineral (NPK), fraccionadas.

  • Aplicar 1 000 g árbol-1 de fertilizante mineral (NPK) de forma alterna o continua en aras de obtener el mayor beneficio económico.

BIBLIOGRAFÍA

1 

1. Herrero G, Muniz O. Nutrición de plantaciones de Pinas Caribaea var. Caribaea: Respuesta a la fertilización y métodos de diagnósticos. 2001.

2 

2. Stevenson MA, McGowan S, Anderson NJ, Foy RH, Leavitt PR, McElarney YR, et al. Impacts of forestry planting on primary production in upland lakes from north-west Ireland. Global change biology. 2016;22(4):1490-504.

3 

3. Venegas R, Palazuelos R. Control químico de malezas arbustivas y arbóreas en plantaciones de Pinus radiata D. Don. Bosque. 1999;20(1):79-88.

4 

4. Reyes-Millalón J, Gerding V, Thiers-Espinoza O. Fertilizantes de liberación controlada aplicados al establecimiento de Pinus radiata D. Don en Chile. Revista Chapingo. Serie ciencias forestales y del ambiente. 2012;18(3):313-28.

5 

5. Reyes Pozo JL, Herrero Echeverría G, León Sánchez MA, Miñoso Bonilla Y, Curvelo Gómez S. Respuesta a la fertilización de plantaciones de Pinus caribaea Morelet var. caribaea Barret y Golfari en su hábitat natural en diferentes edades. 2014;

6 

6. León-Sánchez MA, Reyes-Pozo JL, Herrero-Echevarría G, Pérez-León VE. Efecto de la fertilización sobre el crecimiento en diámetro y altura de Pinus caribaea en plantaciones del occidente de Cuba. Madera y bosques. 2016;22(3):87-101.

7 

7. Awan AB, Frías G. Los suelos de la estación experimental forestal de Viñales, Pinar del Río. Baracoa. 1970;2(1):19-30.

8 

8. Herrero G, González M, Fuentes I, Herrera P, García A, Coto O. Fertilización a Pinus caribaea en su hábitat natural y diversidad vegetal asociada. In Heredia, Costa Rica: Inisefor; 2004. p. 18.

9 

9. Soil Survey Staff. Claves para la Taxonomía de Suelos. 12th ed. Estados Unidos: Departamento de Agricultura de los Estados Unidos Servicio de Conservación de Recursos Naturales; 2014.

10 

10. IUSS Working Group WRB. World Reference Base for Soil Resources 2014, update 2015 International soil classification system for naming soils and creating legends for soil maps. World Soil Resources 2015; Reports No. 106. FAO: Rome; 2014.

11 

11. Hernández J, Pérez J, Bosch I, Castro SN. Clasificación de los suelos de Cuba. San José de las Lajas, Cuba: Ediciones INCA; 2015.

12 

12. Goldstein H. Multilevel statistical models. Vol. 922. John Wiley & Sons; 2011.

13 

13. Hernandez M, Gómez T, Molina J, León MA, Caballero R. Efficiency in forest management: A multiobjective harvest scheduling model. Journal of Forest Economics. 2014;20(3):236-51.

14 

14. FAO. Guía de fertilizantes y nutrición vegetal. Boletín FAO No 9: Fertilizantes y nutrición vegetal. 1986. 198 p.

15 

15. Reyes Pozo JL, León Sánchez MA, Herrero Echeverría G. Fertilización fraccionada en plantaciones de Pinus en suelos alíticos. Publicia; 2017.

16 

16. Reyes JL. Fertilización fraccionada en plantaciones de Pinus caribaea var. caribaea y su impacto sobre algunos indicadores ambientales. Tesis de doctorado. Ciencias Forestales. Facultad de Agronomía y Forestal; 2016.

17 

17. Ojeda H, Rubilar RA, Montes C, Cancino J, Espinosa M. Leaf area and growth of Chilean radiata pine plantations after thinning across a water stress gradient. New Zealand Journal of Forestry Science. 2018;48(1):10.

18 

18. Rodríguez J, Álvarez J. Nutrición y fertilización de las plantaciones forestales. Santiago de Chile: Forestal Mininco SA. 2010;

19 

19. Jokela EJ, Stearns-Smith SC. Fertilization of established southern pine stands: effects of single and split nitrogen treatments. Southern Journal of Applied Forestry. 1993;17(3):135-8.

20 

20. Herrero G, Romeu P, Garcia A, Rivero M, Geigel FB. Efecto de niveles y portadores fosfóricos en el desarrollo de Pinus caribaea var. caribaea II. Suelo Fersialitico Rojo perdusco Ferromagnesial. Centro de Información y Documentación Agropecuario: La Habana, Cuba; 1989.

21 

21. Chinchay LSL. Buenas prácticas agrícolas: uso de los fertilizantes nitrogenados en la minimización de la emisión de gases de efecto. Revista Científica Ingetecno. 2015;4(1).

22 

22. Reyes Pozo JL, León Sánchez MA, Herrero Echeverría G. Influencia de la fertilización mineral sobre la retención de carbono en una plantación de pino. Revista mexicana de ciencias forestales. 2019;10(51):4-22.


Recibido: 14/03/2019

Aceptado: 30/07/2020


Los autores de este trabajo declaran no presentar conflicto de intereses.

Este artículo se encuentra bajo licencia Creative Commons Reconocimiento-NoComercial 4.0 Internacional (CC BY-NC 4.0)

La mención de marcas comerciales de equipos, instrumentos o materiales específicos obedece a propósitos de identificación, no existiendo ningún compromiso promocional con relación a los mismos, ni por los autores ni por el editor.


Traducir DocumentoOriginal article

Dose and frequency of mineral fertilizer for the establishment of pine plantations in acid soils

  [*] Author for correspondence: investigacion4@eetsj.co.cu


ABSTRACT

In Cuba there are few studies aimed at recommending doses and frequency of NPK mineral fertilizer for the establishment of forest plantations, these are used incorrectly without taking into account the negative consequences that can result from their application both in excess and in defect. Therefore, the present study studied the response of different doses and frequency of mineral fertilization applied fractionally during the first five years of establishment of a plantation of Pinus caribaea. The research was conducted at the Viñales Agroforestry Experimental Station, Pinar del Río, Cuba. Different doses and frequencies of NPK were investigated, from a randomized block design. Seven treatments were established, differentiated by NPK doses and application regimens, plus a control treatment without fertilization. Measurements of height and diameter were made at different ages with which the volume was determined and followed for 41 years, and the growth functions were estimated by means of multilevel regression. For the entire period it was determined that the applications of 600 g tree 1, 800 g tree-1 and 1000 g tree-1 in alternate or continuous regime (NPK) were superior with respect to the control; treatment of the application of a single dose of 300 g tree-1 (NPK) caused lower values with respect to the control.

Key words:
mineral fertilization; quantity; frequency; yield.

INTRODUCTION

The beneficial effects of fertilizers on plant biology are well known. However, its incorrect application, both in excess and in defect, can have negative consequences 1).

In Cuba, in the forestry branch and at the production level, the use of chemical fertilizers is minimal and their dosage leaves much to be desired because, at best, it is used tentatively, even before studies and research.

An indigenous conifer of Cuba is Pinus caribaea var. caribaea. Due to its high ecological plasticity and rapid growth - among Cuban pines - it has been widely used in reforestation plans throughout the Cuban archipelago. This tree grows naturally in poorly fertile soils 1.

However, the plantations established in Alitic soils of Low Red and Yellowish Clayey activity in Pinar del Río province, which originally constituted their habitat and they were subsequently marginalized by agriculture, in general, do not correspond to the productive potential of the species, due to low annual increases in timber volume 1.

One of the most critical periods for the development of forest plantations is establishment, during which there is an increasing nutritional demand. Therefore, during this period, fertilization and weed control are used as silvicultural practices 2.

Fertilization stimulates tree growth and makes them more competitive against weeds, which does not prevent adequate control of these 3. The combined action of these two practices should lead to better tree growth; however, the results differ depending on the conditions of each site, as observed in Pinus radiata D. Don, 4,5.

During the 1970s, a series of fertilization experiments were established throughout the country, at the Viñales Agroforestry Experimental Station, in an Alitic soil of Low clayey activity. In this order of ideas, a mineral fertilization experiment was established that contemplated fractional applications of NPK with the objective of determining the best doses and frequencies of NPK mineral fertilizer to obtain high volume yields of wood with bark in plantations established in these soils.

MATERIALS AND METHODS

The experiment was established at the Viñales Forest Experiment Station, which is located between 22º 37´ north longitude and 83º 41´ west longitude and at an elevation of 150 m a.s.l 6.

At the beginning of the plantation, the temperature values were taken from the closest Meteorological Station belonging to Pinar del Río city, according to which the annual average temperature is 24.7 ºC and the daily maximum is 28.7 ºC, the daily minimum of 20.4 ºC and the absolute minimum of 16.2 ºC 7.

The response to fertilization was evaluated in height, diameter and volume at 35 and 41 years 5, the different treatments were compared using ANOVA based on a randomized block design, 6) they studied the response in height and diameter during throughout the period of the experiment, the results were evaluated by determining growth curves with the use of multilevel modeling. It worked with the same data used in these articles to determine the most appropriate doses and frequencies of NPK mineral fertilizer to obtain wood volumes higher than the non-application of fertilizer, using volume growth curves through multilevel modeling.

Experimental design

The experiment gives continuity to a series of measurements made on the same trees since 1971 8, to a fertilization test designed in random blocks with four replicates and eight treatments, established by the Experimental Forestry Station of Viñales that contemplated fractional applications of NPK with formula 8-10-10 (Table 1), tested four doses of mineral fertilizer NPK 300, 600, 800 and 1 000 g tree-1, with two application frequencies in years alternate and continuous.

The fertilizer (NPK) was applied in ridges, in the form of a crescent, around the seedlings. These were planted according to the method of hole, it was applied at the beginning of the rainy season in July during the first five years of planting. The origin of the seeds was from the Marbajitas seed mass. The plantation frame was 3 x 3 m. The size of the plots was 225 m2 with a total of 25 trees and nine in the useful plot. Trees in the useful plot were tagged and followed up throughout the trial period.

The experiment was established in 1971 by the Viñales Forestry Experiment Station and fertilizer applications began in this year until 1976.

The soil in which the plantation was established is classified as Ultisols 9) and classified as Alisol and Alitic with Low clayey activity 10,11, with slopes of 4.3 %, derived from quartzite shales and slates. The total depth of the soil is 1.15 m; but, due to the accumulation of clay on horizon B and poor internal drainage, factors that limit root penetration, the effective depth is 20 cm 1.

Dasometric measurements

To evaluate the response of the species to fertilization, the number of live trees ha-1 was calculated, the height and diameter at 1.30 cm of the soil of the trees of the useful plot were measured, with hypsometer and caliper, respectively.

There are measurements from the year 1973 at the age of two years of the trees until 2012 (41 years of age), this work studies the behavior of the main dasometric variables before the different doses and frequencies of the applied mineral fertilizer.

Live trees ha-1: were estimated from the number of live trees in the useful plot.

Height was measured and evaluated at 2, 6, 8, 15, 33, 35 and 41 years of age of the plantation, the number of live trees ha-1 and the diameter at 6, 8, 15, 33, 35 and 41.

Height (h): they were carried out with a graduated ruler up to two years after planting and with a Blume-Leiss hypsometer, when they exceeded five meters.

Diameter (d): with graduated caliper 1.30 m from the ground.

The volumes of wood corresponding to each of the plots were calculated by adding the volumes of the surviving trees, thus the valued volumes reflected the changes in the number of live trees per hectare, which were estimated from the six years of age and were calculated, taking into account the number of live trees per hectare, by Hubert's formula:

where:

  • V.- volume of wood per tree, m3 tree-1

  • D1.30 - diameter 1.30 m from the ground (cm)

  • h - height (m)

  • Cf.- morphic coefficient, (0.5 for P. caribaea)

Statistical analysis

To estimate the effect of the different doses and the frequency of the mineral fertilizer applied on the growth of the volume variable in individual trees, growth curves were estimated with the use of multilevel modeling 12, the MLwiN version 2.02 program was used. Two levels are defined, repeated measures constitute level 1 nested in individuals, trees, level 2. The general multilevel model is as follows:

where:

  • Y ij : value of the result variable for instant i in individual j

  • P explanatory variables X p at level 1 (p = 1 P)

  • Q explanatory variables Z q at level 2 (q = 1 Q)

  • u 0j : level 2 random effect

  • e ij : level 1 errors

The errors e ij are assumed to follow a normal distribution with variance σ2.

Several models are adjusted for the variable volume of wood response, selecting the best one from the deviation values as an indicator of the quality of the adjustment. It works with a significance level of 5 %.

Hierarchical growth models were adjusted where the dependent variable was volume and the independent variables were age and treatments.

Treatments are entered into the model as categorical variables with the reference category being the control (T1). The Mini 2.1 statistical package was used.

Univariate analyzes of variance and multiple comparisons tests of Duncan and Bonferroni were performed for the variable mean annual increase (IMA).

Economic analysis

For the calculation of the economic benefit, only the volume of wood in m3 ha-1 at the age of 41 years of planting was taken into account (Table 2), the cost of fertilizers in CUP ($ 2,800.00), the Fertilizer application cost of $ 81.60 (CUP) and the value of the m3 of wood in bolus ($ 73.30) data taken from 13.

The economic benefit was calculated by the formula:

where:

  • Vn - volumes of wood for treatment n

  • V0 - volume of wood for the control

  • C - cost of bolus pine wood (CUP m3)

  • Cfer - cost of fertilizers (CUP t-1)

The Value/Cost relationship (V/C) was calculated by the following expression 14:

RESULTS AND DISCUSSION

To evaluate the long-term response to applied mineral fertilization according to the established test, the level of response is measured from variables and indicators that measure productive potential in each of the treatments. Then, the comparison between them is established, with emphasis on contrast with the control treatment.

Response to fertilization expressed in volume of wood with bark

All the fertilizer treatments showed significant differences with respect to the control treatment, except for the T2 treatment where a single dose of fertilizer was applied (Table 3) in coincidence with 15, which ensures that the conifers need nutrients to grow and when they do not obtain them at adequate levels, they present problems with their development and growth, due to nutritional imbalances caused by the application of doses below the required levels 8.

Model 1 without predictors only estimates the value of the constant. Model 2 includes the speed of growth in volume (age coefficient) and the acceleration of this growth (age coefficient squared) and the term cubed age. The inclusion of these terms significantly increases the quality of the model with a decrease in -2ll of 448.49. Model 3 includes the treatments, in addition to the effects of growth, there is a significant improvement with respect to models 1 and 2 (difference in -2ll 470.89 and 22.4, respectively), no significant differences are seen between the treatment 2 and the witness.

Model 4 was the most explanatory, only age*treatment interactions and terms associated with growth are included. Significant interactions indicate that the rate of growth in volume with age depends on the treatment that the plantation has undergone.

The statistically significant negative sign of the age coefficient*T2 is an indicator that with this treatment, over time the increase in volume is less than that of the control treatment, which is the reference category.

For treatments T3, T4, T5, T6, T7 and T8, among which there are no significant differences in the mean volume (Table 4), it was found that the speed of growth in volume with age was statistically higher than that of the witness treatment.

The graphic representation of the coefficients of the variables associated with the treatments in model 3 (Figure 1) shows that the treatments T6, T7 and T8 to which doses of 800 and 1,000 g tree-1 of NPK were applied in regime alternate or continuous had better responses in volume of wood in m3 ha-1 than the control treatment.

The T2 treatment to which a single dose of 300 g tree-1 was applied showed lower results for this variable than the control treatment.

In general, it is observed that the treatments T6 (800 g NPK tree-1 A), T7 (1, 000 g NPK tree-1 C) and T8 (1 000 g NPK tree-1 A) are in the group of that the greatest differences show in relation to the control, the T7 treatment where it was applied (1,000 g NPK tree-1) in successive years was the treatment where the highest values were reached.

Another author proposes 16 that the persistent effect for long periods of the fertilizers applied to trees in their early stages of development, has been demonstrated in various latitudes and is explained by the establishment of the biogeochemical cycle after canopy closure.

When analyzing the effect of mineral fertilization on the volume corresponding to the T2 treatment, the mean values were lower than the control in the last three measurements (as occurs for the height in 2004, 2006 and 2012 and for the diameter in 2004) 5,6. This shows that with the rational application of nutrients, increases in yields can be obtained.

There is little evidence of responses to nitrogen fertilization to the establishment of P. radiata17; however, it is common to observe a greater growth and homogeneity of the plantation in the first year of growth, in eroded soils of the first rotation of this pine.

Differentiated responses ranging from 2 m3 ha-1 year-1 to 14.5 m3 ha-1 year-1, to the fertilization of P. radiata plantations in different places, at five years of age, have been reported 18.

Studies carried out where they tested fertilization with N and P in Pinus taeda plantations with 240 kg ha-1 of N and 60 kg ha-1 of P in a single dose (without subdivisions), and 60 kg ha-1 of N plus 60 kg ha-1 of P, as fertilization at the time of planting and, after 2 years, 180 kg ha-1 of N (fertilization in different doses until totaling 180 kg ha-1) were added 19.

The authors verified after eight years of measurements, an increase of 93 % in basal area and 39 % in volume. Furthermore, the authors conclude that there were no significant differences between single and quota fertilizations, despite the fact that quota fertilization is more interesting so as not to overburden the initial costs of planting implantation.

Average annual increase in volume

Shapiro Wilk's tests resulted in normality for all years with probabilities greater than 0.190 (Table 5). The results of Duncan's multiple comparison tests are seen in (Figure 2) using the first letters of the alphabet next to the error bars.

When evaluating the evolution over time of the average annual increases in volume according to the different treatments (Figure 2), an increase in volume of more than 3.97 m3 ha-1 year-1 is determined in relation to treatment T1 and T2.

In the latter, where the lowest dose of fertilizer was applied, it was shown that the addition of a small amount of fertilizer only in the first year of life, is not effective for reaching optimal volumes, coinciding with the results obtained 1 who state that when a single initial fertilization is carried out in Alitic soils with low clay activity, there is no response to fertilization.

In 2004, the average annual increases in volume corresponding to the T2 treatment were lower than the control. It was observed that the highest doses of fertilizers applied in successive or alternate years allow the highest volume increases, as occurred for height and diameter 5,6. The T7 treatment (1,000 g NPK tree -1) caused the greatest effects in this growth indicator.

The application of 1,800 g NPK tree-1 (20, divided into four applications in continuous years, is recommended in an experiment established in the same study area. The results obtained in the present work indicate: i) that the fractional application of NPK (complete formulas) in alternate or continuous years allows to increase yields appreciably, and ii) the application of complete formulas is more convenient.

The annual mean increases in average volumes were significantly different in the last three years of evaluation (Figure 2). In all the years evaluated, the treatments where fertilizer doses higher than 300 g tree-1 were applied allowed to obtain increases in higher volumes with respect to T2, in the same way the control treatment behaved where, despite there being no significant differences with in T2, its mean values were 12.3 higher; 4.4 and 3.6 % in the last three years respectively.

In all the years, the T7 treatment where a dose of 1,000 g NPK tree-1 was applied in successive years was the one with the best performance, with appreciable differences in relation to the control and T2, except in 1979 where there were no differences between the treatments. T2 and T7, another author agrees and suggests that mismanagement of the correct dosage, source, timing, or location of the fertilizer (N), and lack of proper balance with other essential nutrients can increase total loss of N (21.

Economic analysis

The treatments T3, T4, T5, T6, T7 and T8 reported positive economic effects, except for treatment T2 where a minimum dose of 300 g tree-1 was applied, in Figure 3 the differences in economic benefit and the value relationship are presented/cost of the treatments with respect to the witness. The gains for the treatments from T3 to T8 are above $ 6,000 ha-1, standing out the T8 treatment with the highest gain, higher than $ 9,992 ha-1, the losses caused in the T2 treatment were less than $ 2,300 ha-1 at 41 years of age of the plantation and the V/C ratios for treatments T3, T4, T5, T6, T7 and T8 were greater than two, a value that, as recommended 14, is acceptable for an investment in fertilization.

In general, treatments T3, T4, T6, T7 and T8 were the ones with the best results achieved, highlighting T8 with an economic benefit of more than $ 9,992 ha-1 and a value/cost ratio of more than 2.5. It is important to highlight that the T7 treatment has behaved as the most stable in all the variables evaluated throughout the development process of this work in the economic analysis, despite obtaining a value/cost ratio of 2.5 lower than other treatments. , its economic benefit is greater than $ 8,000 ha-1. Any of these last variants represents an attractive option for silvicultural management, depending on the fertilizer available and the use for which the wood is intended, in order to obtain the maximum yield in volume, as well as the highest profits and the best value / cost ratio 22.

CONCLUSIONS

  • The results presented have repercussions for the productive practice since they constitute an ecologically sustainable and economically viable way to obtain greater wood productions, in less time and space.

  • The doses of mineral fertilizer of 600 g tree-1, 800 g tree-1 and 1 000 g tree-1 allowed obtaining volumes of wood with bark superior to the control treatment, the treatment where a single dose of 300 g tree-1 was applied. The treatment resulted in lower yields lower than those achieved by the control treatment.

  • The treatments from T3 to T8 were those of greater economic benefit with a value/cost ratio equal to or greater than 2.5.

RECOMMENDATIONS

  • Apply 1,000 g tree-1 of mineral fertilizer (NPK) continuously, fractionated in doses of (200, 200, 400 and 200 g tree-1 in the first four years) for the establishment of P. caribaea plantations in the acid soils in Pinar del Río.

  • Apply for the establishment of forest plantations, the doses of 600 g tree-1, 800 g tree-1 or 1,000 g tree-1 of mineral fertilizer (NPK), fractionated.

  • Apply 1,000 g tree-1 of mineral fertilizer (NPK) alternately or continuously for the best economic benefit.